

There are both acceleration and deceleration configurations every few years but for 11 years periods one dominates the other and the best aligned L-shapes are always around solar minima. I have only included the 1900s but I have checked the 1800s also showing the same.
Because the Sun is revolving around the barycenter it will have to decrease it's rotation when beeing accelerated and visa versa. We should perhaps be able to detect this variation, and we are:

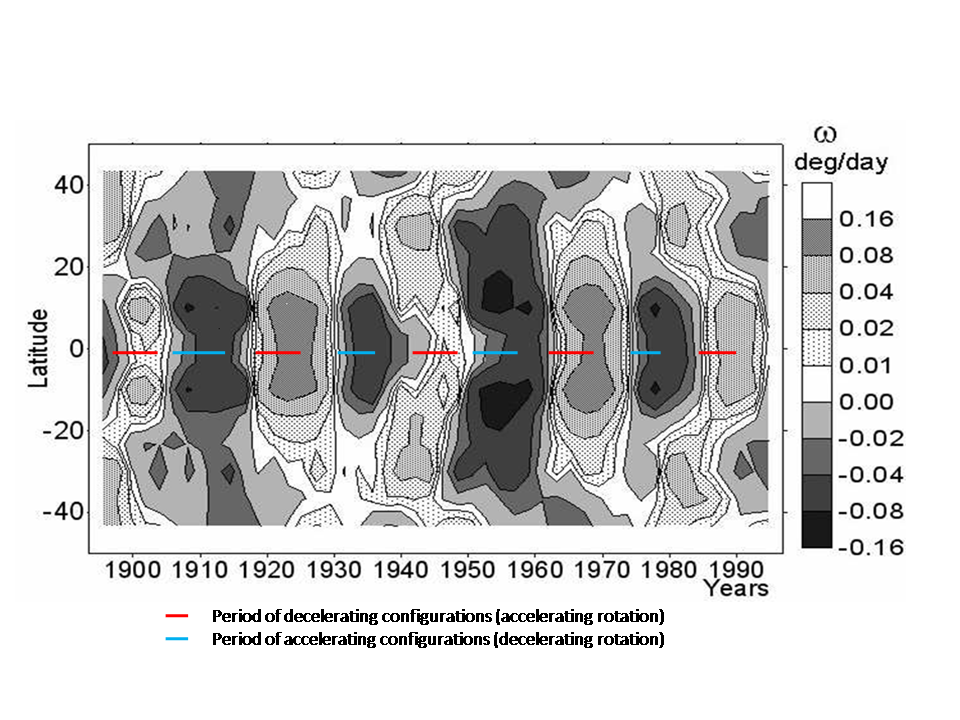
Figure 3. The deviation of the rotation velocity from its average value at
corresponding latitudes. The "window" for the spectral analysis was 12 years.
The regions where rotation decelerates painted dark. The velocity was averaged
over the northern and southern hemispheres.
From: http://www.solarstation.ru/TL/PDF/tl_22.pdf
22-Year Variations of the Solar Rotation
A. G. Tlatov and V. I. Makarov
Kislovodsk solar station of the Pulkovo observatory, Kislovodsk, Russia
Pulkovo Astronomical Observatory, Saint Petersburg, Russia
Then we put in the periods of favourable configuration (from http://math-ed.com/Resources/GIS/Geometry_In_Space/java1/Temp/TLVisPOrbit.html)
Perhaps we should also be able to find traces of the planatary conjunctions in the Sun.
The following figures are from http://arxiv.org/PS_cache/arxiv/pdf/0711/0711.0799v1.pdf
Temporal Variations in the Sun’s Rotational Kinetic Energy
H. M. Antia, S. M. Chitre and D. O. Gough
Blue lines with conjunctions my addition
